The Foundation for Peer to Peer Alternatives
Gapminder, a very powerfull tool
Amigos, the graph you are seeing illustrates
my last post, it was done with the
Gapminder
 .
.
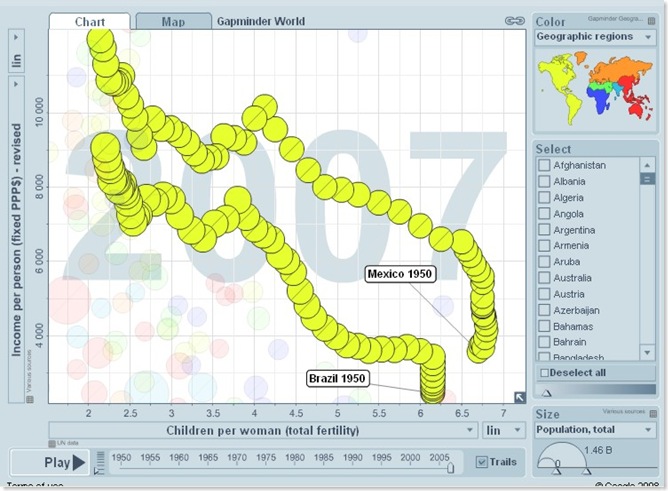
Gapminder is a grate tool, you can graph many social variables, express them
in logarithmic o linear graphs, also you can animate them.
In the example you can see children per mother born alive against income per
person. Notice the reduction in the vegetative ratio of the families mainly
between years 1960 e 1985. Mexico´s case decreases around a child each five
years.
Go and
you play now
Views: 96
Add a Comment
© 2024 Created by Josef Davies-Coates.
Powered by
![]()
You need to be a member of P2P Foundation to add comments!
Join P2P Foundation